


With inflation up and premiums down, it was a sticky end to the year for insurers. But could signs of stablisation be a cause for optimisim in the new year?
The year 2010 was not a good one for average premiums in commercial lines. Acturis co-chief executive Theo Duchen comments: “There is no class of business that the indices cover where 2010 average premiums are higher than 2007 average premiums, with most classes 3%-5% off their 2007 values.
"When one considers that cost inflation in the same period amounted to some 11%, it underlines the pressures facing brokers and insurers alike.”
Commercial Combined
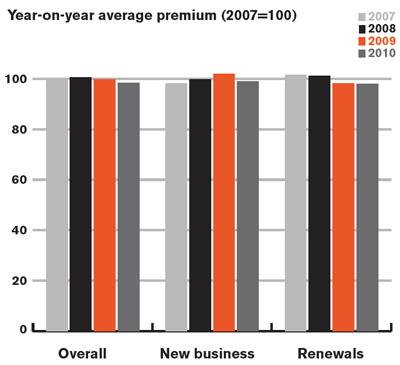
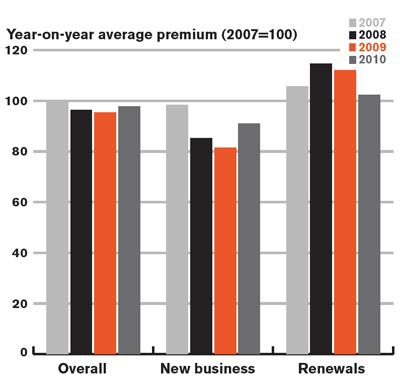
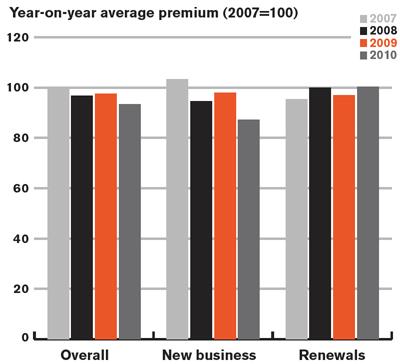
The Acturis Commercial Combined Index ended 2010 some 5% below its 2007 average, and 3% below its 2009 average. Looking at year-on-year comparatives, it can be seen that this fall was largely driven by new business premiums falling from 93% of the 2007 value to 87%, with renewal premiums only falling from 101% to 99%.
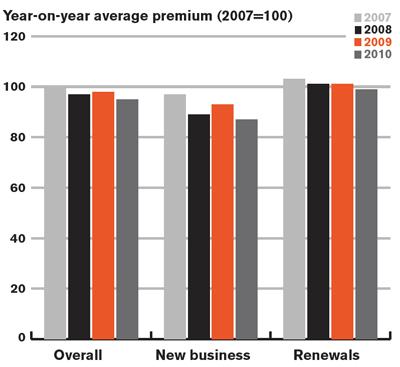
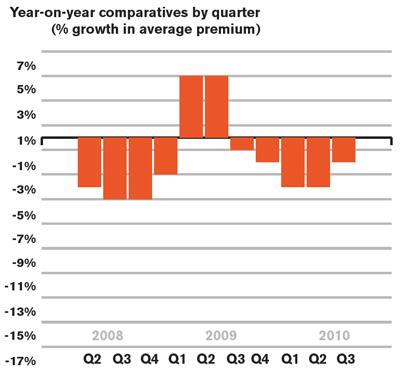
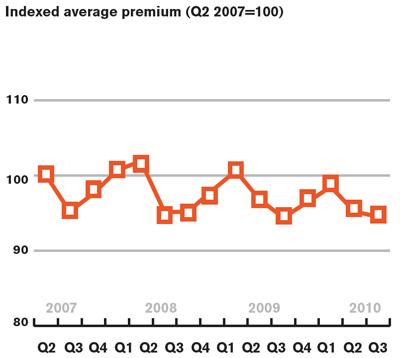
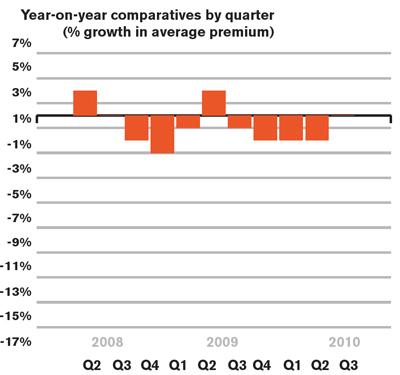
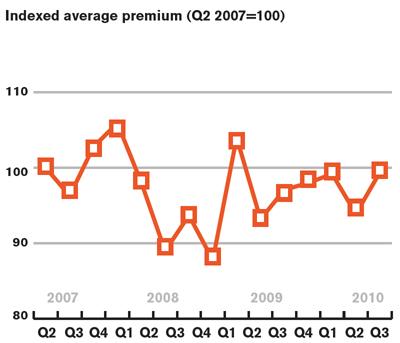
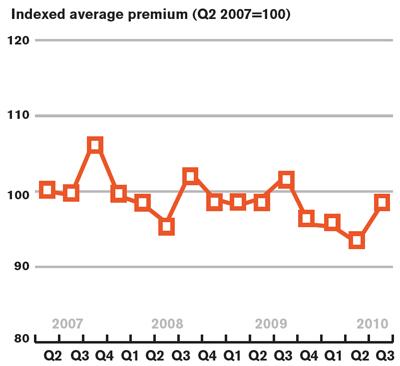
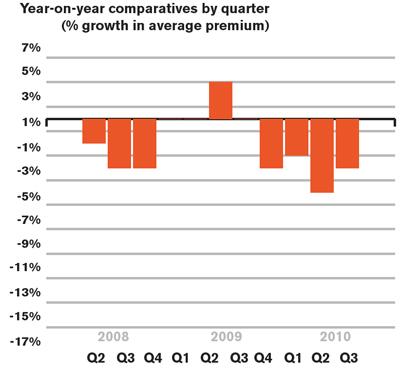
The trend of negative year-on-year by quarter growth since Q3 2009 continues, although the decrease in year-on-year indexed average premium for Q4 2010 is the smallest of the year (1.7% compared to over 4% in Q2 and Q3), which may give reason for optimism that the fall in average premium may stabilise going into 2011. The Acturis Commercial Combined Quarterly Index rose 2.2 percentage points from Q3 to Q4, displaying a similar trend to corresponding times of year in 2007 and 2008.
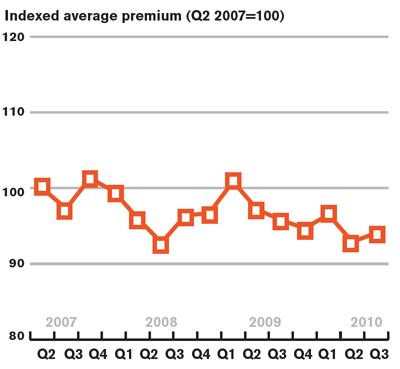
This brings the commercial combined average premium to 94.1% of the Q2 2007 value in Q4, representing a 1.7% decrease relative to Q4 2009.
Fleet
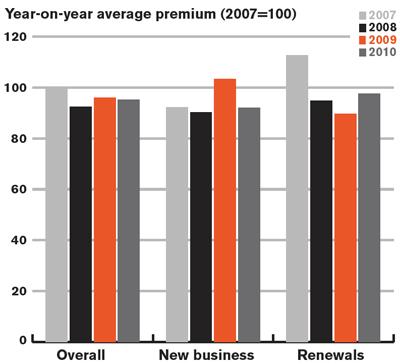
The Acturis Motor Fleet Index continues its stable behaviour. The overall year-on-year comparative shows little movement – a slight fall from 99.8% of the 2007 value in 2009 to 98.5% in 2010.
This fall was a result of new business premiums falling from 102% of the 2007 value to 99%, with renewal premiums staying stable over the last two years.
Motor fleet premiums continued to exhibit stable behaviour in 2010, with an extremely small drop in average premium between Q3 and Q4, from 95.2% to 94.5% of the Q2 2007 value. This is almost the same value as the Q4 2009 value of 94.4%, which results in the 0% figure displayed by the year-on-year comparative by quarter analysis below.
Property Owners
The Acturis Property Owners Index has recovered slightly from its 2009 lows. The year-on-year comparative reflects this, with indexed average premium rising 2.4 percentage points to 97.8% of the 2007 value.
This analysis also shows that the increase was driven by an increase in new business premiums, which rose almost 10 percentage points. This increase was, however, tempered by a considerable fall in renewal premiums.
Looking at the Acturis Property Owners Quarterly Index, we see that from a cyclical Q3 drop in 2010, the index has risen to 99.4% of the 2007 value in Q4.
Encouragingly, this represents a 2% increase on Q4 2009 as displayed on the year-on-year comparative by quarter graph. This paints a largely positive picture of 2010 for the Property Owners Index, with premiums much more stable than previous years.
Packages
The fall in the Acturis Packages Index continues. Average premiums in 2010 were 93% of their 2007 value, down some 3% from 2009. This fall in average premium in 2010 was due to a large decrease in new business premiums (which fell from 98% of the 2007 value in 2009 to 87% in 2010). Despite significant increases in renewal premium (97% of the 2007 value in 2009 to 100% in 2010), this was not enough to prevent the slide in the overall packages index.
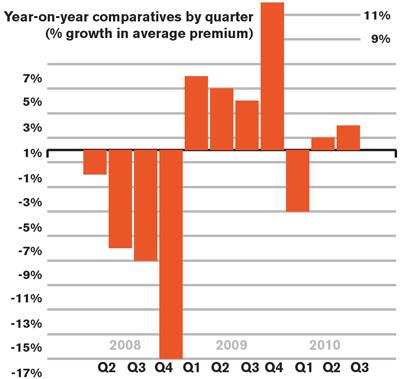
As suggested by the trends displayed in previous years, the Acturis Packages Quarterly Index showed a significant increase from Q3 to Q4 in 2010, from 93.2% of the Q2 2007 value in Q3 to 98% in Q4.
However, it must be born in mind that despite this increase, there was a 4% drop in average premium compared to Q4 2009, meaning the year-on-year comparatives by quarter have shown negative growth each quarter in 2010, underlining the competitive nature of this product class.
Combined Liability
The Acturis Combined Liability Index is a new index introduced last quarter. It is based upon premiums written using combined liability products on the Acturis system. Until Q3 2010, premiums fluctuated little since the inception of this index. Again, the story for this class of business is not good. The Acturis Year-on-Year Comparative Index shows that average premium fell slightly from 96% of the 2007 value in 2009 to 95% in 2010.
As with other indices (with the exception of property owners), this was a result of a substantial fall in new business premiums being counteracted by solid increases in renewal premiums. The Acturis Year-on-Year Comparative Index by Quarter shows a second consecutive decrease relative to average premium the previous year.
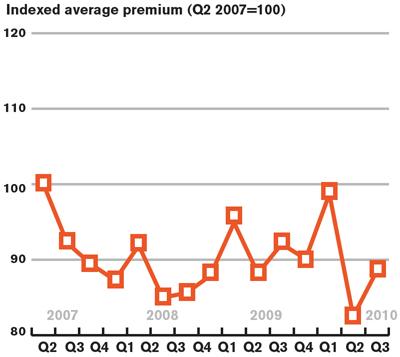
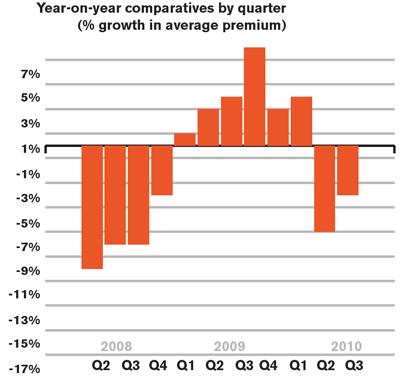
While the Q4 2010 fall of 4% relative to Q4 2009 is somewhat concerning, it should be noted that this figure is mainly a result of the large fall in average premium from Q2 to Q3 in 2010. Average premium actually recovered strongly in Q4 2010, rising from 83% of the Q2 2007 value in Q3 to 89% in Q4, the largest increase from a Q3 to a Q4 since the inception of this index, although still substantially lower than premium in 2007.
Basis of calculation for indices
All renewal and new business trades on the Acturis system in a particular class for 2007 (Q2 onwards), 2008, 2009 and 2010, with extreme values removed: Combined: £500-£65,000 premiums; Packages £50-£4,000 premiums; Property Owners £125-£60,000 premiums; Fleet £500-£60,000 premiums; Combined Liability £125-£60,000 premiums. Property Owners includes commercial, residential and mixed business.