


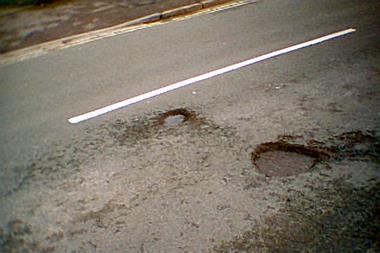
Belfast is listed as the pothole claim hotspot
UK drivers have claimed £4.1m in damages as a result of driving over potholes in the past three years, according to data from price comparison website GoCompare.
Its Pothole Potluck study, which is based on Freedom of Information (FOI) requests sent to 67 UK councils, revealed which UK motorists are claiming the most as a result of driving over potholes.

Belfast ranked first, claiming £152,454.38 in pothole damages between 2020 and 2021, with Birmingham coming in a close second – claiming £114,692.00.
Newcastle reported the least amount of insurance claims attributed to potholes, with £3,149 being paid out in the past three years. Bradford, Milton Keynes and Sutton also reported low numbers of claim payouts related to potholes between 2018 and 2021 - at £8,636, £7,174 and £5,232 respectively
Drivers also submitted claims with Highways England, the government-owned company charged with operating, maintaining and improving England’s motorways and major A roads.
Highways England reported £673,560 worth of claims between 2018 to 2021 – 70% less than Belfast’s total claims.
Problematic potholes
Ryan Fullthorpe, motor expert at GoCompare, said: “This piece of research really highlighted the issue that is potholes - something that may seem small at first, but it actually affects a huge amount of people across the UK on a daily basis.”
When deciding whether to make a claim, Fullthorpe stated that drivers should be aware that claims should be made either from your insurer or the council, but not both.
He added: “Regardless of claim, you should always report a pothole if you see one as they may be annoying to some drivers, but could ultimately be dangerous to others.”
| Rank | City or Town | Total claimed by drivers last year (£) 2020/21 | Total amount claimed by drivers (£) 2018-2021 |
|---|---|---|---|
|
1 |
Belfast |
£152,454.38 |
£1,410,375 |
|
2 |
Birmingham |
£114,692.00 |
£682,560 |
|
3 |
Highways England |
£114,692.00 |
£673,560 |
|
4 |
Stoke |
£2,299.28 |
£426,762 |
|
5 |
Tamworth |
£45,419.00 |
£387,093 |
|
7 |
Norwich |
£2,835.00 |
£89,842 |
|
8 |
Manchester |
£1,744.00 |
£79,144 |
|
9 |
Liverpool |
£727.24 |
£62,148 |
|
10 |
Brent |
£650.00 |
£46,677 |
|
11 |
Blackpool |
£2,073.05 |
£43,731 |
|
12 |
Maidstone |
£72.00 |
£36,825 |
|
14 |
Coventry |
£314.00 |
£18,756 |
|
15 |
Bolton |
£1,952.00 |
£18,473 |
|
17 |
Bath |
£227.00 |
£17,395 |
|
19 |
Wigan |
£929.00 |
£16,800 |
|
21 |
York |
£2,163.32 |
£15,370 |
|
22 |
Stockport |
£301.50 |
£13,670 |
|
23 |
Rotherham |
£3,460.96 |
£12,296 |
|
25 |
Wakefield |
£540.00 |
£9,565 |
|
26 |
Ealing |
£1,005.00 |
£9,326 |
|
27 |
Plymouth |
£2,082.13 |
£9,194 |
|
28 |
Wolverhampton |
£2,176.91 |
£8,757 |
|
29 |
Bradford |
£162.00 |
£8,636 |
|
30 |
Milton Keynes |
£328.64 |
£7,174 |
|
33 |
Sutton |
£3,500.04 |
£5,232 |
|
34 |
Newcastle |
£1,082.46 |
£3,149 |


No comments yet